This article was created to claim the title "The art of training your model" ("TATYM") for an upcoming book.
Thursday, June 1, 2023
Friday, November 25, 2022
Product Metrics
Previous articles in this blog have looked at the usage of metrics for measuring software developer productivity and software delivery performance. This article dives deeper into the topic of measuring software success with product metrics.
- Product metrics measure software success, i.e. the value / acceptance / usage of a product / service by its customers / users.
- DORA metrics measure the software delivery performance of the company / staff providing the service.
- SPACE is a framework to assess software developer
productivity.
[A future article will look at the concept of Developer Experience as another avenue to assess developer productivity.]
A recent LinkedIn Post by Aatir Abdul Rauf provides a good overview by summarizing eight resources on the topic:
- A Guide to Product Metrics (by Mixpanel)
- North Star & Guardrail Metrics (Daniel Lee)
- Defining Product Metrics (Hani Azam)
- 11 Metrics for Product-led Growth (Katryna Balboni)
- SaaS Product Metrics (by Userpilot)
- Ecommerce Metrics (by SendInBlue)
- Marketplace Metrics (Juho Makkonen)
- AARRR, GAME, Pirate Metrics (Anthony Murphy)
According to Hani Azam, product metrics help companies
- have clarity, alignment and prioritization in what to build,
- decide how to build the product once they’ve prioritized what to build, and
- determine how successful they are and hold them accountable to an outcome
He distinguishes between four types of product metrics:
- North Star
- This is the single most important measure of success for a company.
- A North Star Metric (NSM) should be:
- a direct reflection of a company’s mission,
- an indicator of how a company brings value to its customers,
- the only one of its kind,
- the answer to the following question:
what is the one metric that best represents the desired outcome of your company? - Primary/Goal Metric
- Primary metrics depict the desired outcome of a particular product, team or initiative.
- This is unlike the NSM, which represents the desired outcome of the company as a whole.
- Supporting/Tracking/Input Metrics
- Indicators that the NSM (or primary metric) is moving in the right direction.
- Particularly useful as leading indicators to your NSM.
- Tell you where your efforts to move your NSM may be falling short.
- Counter Metrics/Guardrails
- Counter metrics represent other outcomes that the business cares about, which may be negatively affected by a positive change in the primary metric (or NSM).
- Serve as guardrails.
They exist to make sure that in the pursuit of your primary metric, you are not doing harm to another aspect of the business.
Hani provides the following examples for North Star Metrics (NSM) of various companies:

He also comments on the nature of good metrics:
Good metrics should be meaningful, measurable, and moveable / adaptable.
The last part of his article describes how to come up with supporting and counter metrics based on the observation that
the best way to come up with these metrics is by tracing a users journey with your product.
The author refers to a common approach for breaking down the user journey:
AARRR (or Pirate Metric) framework - introduced by Dave McClure - breaks down the user journey by Acquisition, Activation, Retention, Referral and Revenue.
Hani expanded the framework from AARRR to AAAERRR as follows:

- Awareness: How many people are aware your brand exists?
- Acquisition: How many people are interacting with your product?
- Activation: How many people are realizing the value of your product?
- Engagement: What is the breadth and frequency of user engagement?
- Revenue: How many people are paying for your product?
- Retention/Renewal: How often are your people coming back?
- Referral: How many customers are becoming advocates?
Please consult the original article for a more detailed description of the framework with concrete examples of applicable metrics.
Friday, July 1, 2022
Innovation || Imitation
By far the greatest flow of newness is not innovation at all. Rather, it is imitation.
— Theodore Levitt
When a company — for the first time in its history — presents a product that offers a new capability that a competitor had already introduced to the market a year earlier, should that be considered an innovation or an imitation?
In his 1966 HBR article "Innovative Imitation" Theodore Levitt makes the following distinction:
Innovation may be viewed from at least two vantage points:- newness in the sense that something has never been done before, and
- newness in that it has not been done before by the industry or by the company now doing it.
Strictly defined, innovation occurs only when something is entirely new, having never been done before.
A modest relaxation of this definition may be allowed by suggesting that innovation also exists when something which may have been done elsewhere is for the first time done in a given industry.
On the other hand, when other competitors in the same industry subsequently copy the innovator, even though it is something new for them, then it is not innovation; it is imitation.
The newness of which consumers become aware is generally imitative and tardy newness, not innovative and timely newness.Imitation is not only more abundant than innovation, but actually a much more prevalent road to business growth and profits.
Hence the categorization of a new offer as innovation or imitation depends on the definition* of the term "innovation" you adopt - according to the 2007 research paper "Innovation and Imitation as Sources of Sustainable Competitive Advantage".
That paper addresses the following research questions:
- What are the differences between innovating and imitating?
- What factors explain these differences?
- Can imitation be a source of sustainable competitive advantage?
The authors define innovation as a form of technological development that expands not only a firm’s existing knowledge set but also the existing world knowledge set, whereas imitation is defined as the form of technological development that expands the firm’s existing knowledge set but not the existing world knowledge set.
Innovation expands the knowledge existing in the world,
Imitation expands only the knowledge existing in the company that adopts something new.
Three factors: Generation of ideas, timing, and space
The generation of the idea is the starting point for distinguishing between innovation and imitation. Only those companies that generate new ideas can be analyzed as possibly innovative, whereas those that take a previously existing idea should be considered imitators.
The generation of the idea is the necessary condition for obtaining an innovation, but this is not a sufficient condition in itself because, for innovation rather than merely invention, this idea must be put into practice (Damanpour; Schumpeter; Utterback).
The factor of timing must be considered for the differentiation of the two concepts, because generating a new idea means being the first to implement it and launch it on the market.
Innovation must be new for the organization and for its environment of reference. This consideration introduces the variable space (in effect, the global marketplace). This allows to separate the company that generates the idea, produces it, and applies it for the first time anywhere (the innovator) from another (an imitator) that later applies and markets that same idea.
One should distinguish between a company that follows the innovator in the same market (an imitator) and another that adopts an innovation so as to launch it in a different or new market segment or territory.
These three factors, the generation of ideas, timing, and space, help establish a typology of innovators and imitators that corresponds better to the real world.
Organizational attitudes:
Entrepreneurial, Market-oriented
The literature distinguishes between entrepreneurial and market-oriented organizational attitudes as factors influencing innovation.
Companies with an entrepreneurial orientation are “exploiters” of the knowledge generated by the “explorations” of their scientists or R&D personnel, which leads them to propose new ideas that are brought into material form as new products, services, or processes.
They have a greater propensity to generate their own ideas (innovation) rather than to adopt ideas generated by others (imitation).
Entrepreneurial orientation is defined as the approach characterized by
- Innovativeness
(defined as the tendency of an organization to support experimentation and creative processes intended to give rise to innovations), - High-risk projects, and
- Proactivity.
A proactive attitude or stance is identified with technological leadership and with the desire to be first or a pioneer.
The degree of risk incurred by launching an innovation is much greater than that accepted by the company that adopts an imitation because the innovator confronts a change in the knowledge existing at the global level, and incorporates the commercial risk and the technological risk inherent in true innovation.
Market orientation is the concern with or study of the business environment in general, including customers, competitors, suppliers, and other external forces that affect the behavior of the organization. Market-oriented companies continually modify their offer —their products, services, and processes—to satisfy the needs of their market.
Market-oriented companies with a corresponding focus on their clients ("proactive") have a greater propensity to generate ideas to satisfy their customers’ needs and innovate. Conversely, those companies with a focus on competitors ("reactive") have a greater propensity to adopt ideas generated externally and imitate.
Radical innovations emanate from scientific research supported by an entrepreneurial orientation. On the other hand, the strategy aimed at continually satisfying customer needs, characteristic of a market-oriented company, will lead to specialization in the development of incremental innovations.
Incremental innovation can be classified as a “pull”-type innovation, whereas a “push”-type innovation is radical innovation.
Topology of innovative and imitative companies
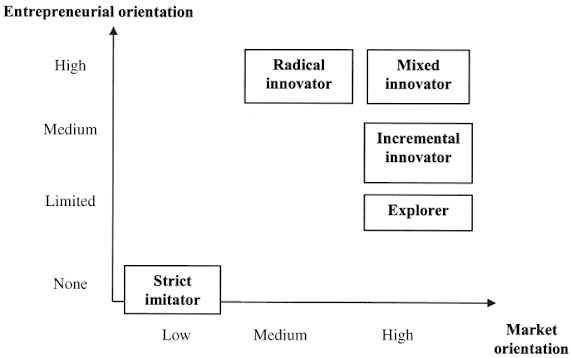
“Incremental innovator”
- Strong market orientation
- Moderate entrepreneurial orientation (proactive attitude)
- Moderate levels of technological and commercial risk
"Radical innovator”
- Moderate market orientation
- Strong entrepreneurial orientation
- High levels of technological and commercial risk
“Mixed innovator”
- Strong market orientation
- Strong entrepreneurial orientation
- Moderate levels of technological and commercial risk
“Strict imitator”
- Weak market orientation
- Lack of entrepreneurial orientation (reactive attitude)
- Low technological and commercial risk.
“Explorer”
- Strong market orientation
- Limited entrepreneurial (proactive attitude)
- Low levels of technological risk and moderate levels of commercial risk
The authors define global innovation as an innovation that is new for the economy as a whole and local innovation as an innovation that is new in a limited environment.
They distinguish between companies that imitate and operate in the same markets as the innovators, and those that do so in different markets.
In the same markets, taking into account the factor of timing, they argue that only the first to generate an idea and apply it as a new product should be considered an innovator, and that all the rest are imitators.
A company that adopts an innovation that is new for the company but has already been successfully applied or marketed in its reference market will be considered an imitator in the strict sense, whereas a firm is categorized as an explorer company if it introduces innovations in a market different from that supplied by the strict innovator company.
A previous article in this blog provides alternative views on how to construct a Typology of Innovation that imposes lesser requirements on the originality of an idea behind a specific type of innovation.
Competitiveness
Please consult the original article for an analysis of how both
innovation and imitation can be a source of sustainable competitive advantage, provided the company is capable of designing a strategy that differentiates it from the innovator.
innovation and imitation can be a source of sustainable competitive advantage, provided the company is capable of designing a strategy that differentiates it from the innovator.
The establishment of barriers to imitation promotes the maintenance of the competitive advantage achieved by the successful innovator, provided this innovation is impossible to substitute.
The innovator will obtain a sustainable competitive advantage based on an innovation if it maintains a strategy of differentiation against the imitator,
whereas the imitator will obtain a sustainable competitive advantage based on an imitation if it maintains a strategy of price leadership against the innovator.
The explorer will obtain a sustainable competitive advantage based on a local imitation if it maintains a strategy of price leadership vis-à-vis the innovator, and a strategy of differentiation against future imitators.
*Note that the definitions introduced earlier in this blog (such as "innovation = successfully exploited ideas") mostly follow Schumpeter in requiring a positive market impact — a positive benefit, especially in the form of an economic improvement — but there are many alternative definitions including those following Thompson that do not (see research paper for bibliography and details). The only common element among all the definitions of innovation is that it implies novelty.

This table classifies the principal authors in terms of whether they consider the subsequent market or commercial success of an innovation as a necessary factor for innovation.
Schumpeter (1961) dealt with innovation within the theory of economic development as a process of putting into practice new combinations of materials and forces.
Thompson (1967) defined innovation as the generation, acceptance, and implementation of new ideas, processes, products, and services (without mentioning the need for the idea to have a positive impact in the market).Monday, June 27, 2022
Creativity Myths
The 2021 study "Creativity myths: Prevalence and correlates of misconceptions on creativity" tries to separate facts from fiction on what creativity is and what it is not.
Psychology Today summarizes the 15 Myths About Creativity covered in that study.
This study examined the prevalence of known creativity myths across six countries from diverse cultural backgrounds and explored why some people believe in them more than others. Results revealed persistent, widespread biases in the public conception of creativity, such as attributing creative achievements to spontaneity and chance rather than persistence and expertise.
The researchers looked through the existing scientific literature to identify 15 creativity falsehoods, which they divided into four categories:Creative Definition Myths
- Creativity cannot be measured
- Creativity is essentially the same as art
- Creative ideas are naturally a good thing
- Most people would not be able to distinguish abstract art from abstract children's drawings
Creative Process Myths
- Creative accomplishments are usually the result of a sudden inspiration
- Creative thinking mostly happens in the right hemisphere of the brain
- Creativity tends to be a solitary activity
Creative Person Myths
- Creativity is a rare gift
- People have a certain amount of creativity and cannot do much to change it
- Children are more creative than adults
- Mental health disorders usually accompany exceptional creativity
Creative Stimulation Myths
- People get more creative ideas under the influence of alcohol or marijuana
- Long-term schooling harms the creativity of children
- Brainstorming in a group generates more ideas than if people were thinking by themselves
- One is most creative when with total freedom in one's actions
“A ‘naivety’ conceptualization of creativity is problematic for two reasons,” say the authors.
The authors contrast the myths with the following
First, relating creativity to childlike behavior and chance implies low appreciation for the hard work behind creative achievements. Second, it externalizes relevant factors in the development of creativity. Emphasizing the role of inspiration rather than active engagement may undermine creativity by suggesting we need to wait until creativity hits us with a ‘Eureka’-experience.
The authors contrast the myths with the following
Creativity Facts


- To be considered creative, something has to be both novel and useful or appropriate
- Teachers appreciate the idea of creativity but not necessarily creative pupils
- Whether or not something is viewed as creative depends on zeitgeist and social norms
- Creativity is an important part of mathematical thinking
- Creative ideas are typically based on remembered information that is combined in new ways
- The first idea someone has is often not the best one
- Alpha activity (10Hz) in the brain plays an important role in creative thought
- Creative people are usually more open to new experiences
- Creative people are usually more intelligent
- Achieving a creative breakthrough in a domain (i.e. publishing a successful novel) typically requires at least 10 years of deliberate practice and work
- Men and women generally do not differ in their creativity
- A man's creativity increases his attractiveness to potential partners
- When stuck on a problem, it is helpful to continue working on it after taking a break
- Positive moods help people get creative ideas
- Getting rewarded for creative performance at work increases one’s creativity
Source: Creativity myths: Prevalence and correlates of misconceptions on creativity - ScienceDirect
Appendix B (.xls) references the research papers backing their claims.
The article Top Ten Myths About Creativity (futurefocusedlearning.net) lists 10 Creativity Myths mostly in line with the study's findings:
- Creativity belongs to the geniuses
- Creativity is making something from nothing
- Creativity can’t be forced
- Mental illness causes creativity
- Drugs make you more creative
- To be creative you need to be free
- Creativity belongs to the arts
- Creativity is a solitary activity
- Extrinsic motivation is detrimental to creativity
- To explain creativity is to damage it
Friday, June 24, 2022
Creativity
In a recent interview Dr. Deepak Chopra made the following statement:
"Creativity is a spiritual experience, not a mental experience."
which made me investigate the topic a little further.
I came across the 2014 book Modeling Creativity (arxiv.org) by Tom De Smedt who summarizes key insights in chapter 4 as follows:

Creativity refers to the ability to think new ideas.
Creative ideas are grounded in fast, unconscious processing such as intuition or imagination which is highly error-prone but allows us to “think things without thinking about them”.
Some of these near-thoughts can emerge without warning as an interesting solution: a moment of insight. This usually happens while tackling everyday problems. This is called little-c creativity.
Big-C creativity, eminent ideas that fill history books, develop gradually. They require interaction with slow, conscious processing. This requires effort and motivation, because consciousness is lazy and tends to wander off.
Flexibility to switch between styles of thought – from unconscious to conscious, from goal-oriented to open-ended, from combinatory to explorative and transformative – is key to creativity: an agile mind.
Another Chopra quote summarizes the above:
"To harness true creativity, you must silence the conditioned mind."
Thursday, June 23, 2022
How to Misuse and Abuse DORA DevOps Metrics
In the How To Measure Software Delivery Using DORA Metrics (YouTube) presentation, Dave Farley, author of "Continuous Delivery" and "Modern Software Engineering" describes how one can apply DORA measurements to drive software development to deliver on this state-of-the-art approach, but also explores a few of the common mistakes that can trip us up along the way.
I found the reference to Bryan Finster's October 2021 presentation How to Misuse DORA DevOps Metrics especially useful.
Bryan contrasts common pitfalls & fallacies with pragmatic and realistic advice.

He also points out that the 4 prominent DORA metrics constitute only the tip of the iceberg.

My earlier blog article on Software Productivity Metrics provides further details on these additional metrics.
Slide #29 in Bryan's deck puts these metrics into perspective ("To improve flow, we must improve CI.") and makes the case for a set of balanced metrics (#34):

Summary ("Closing Thoughts")
- The 4 outcome metrics are only the tip of the iceberg.
- Product development is a complex interaction of people, process, and products. There are no simple metrics.
- Measures require guardrails to avoid perverse incentives.
- Metrics are a critical part of the improvement toolbox, but…
- We cannot measure our way to improvement.
- We use them to monitor and inform the next improvement experiment.
- Don’t measure people, invest in them. They are our most valuable asset.
[July 26, 2022 -- Update:
Abi Noda discusses Finster's recent article in the The DevOps Enterprise Journal | Spring 2022 (itrevolution.com) edition on the same topic:
Common misuses of the DORA metrics
- Focusing too much on speed.
- “Measuring deployment frequency without using quality metrics as guardrails will result in poor outcomes.”
- Setting goals around DORA metrics.
- “The goal isn’t better DORA metrics… OKRs should be focused on desirable business outcomes.”
- Choose goals, then choose metrics that align with those goals.
- Mistaking measuring DORA metrics as a way to improve.
- “[DORA metrics] don’t fix things.
If we simply get a dashboard and do not buy into using it to identify improvement items, then nothing will get better.” - Using DORA metrics as vanity metrics.
- “[DORA dashboards] are often used as ‘vanity radiators’ instead of information we can use to help us improve.”
- Not including other signals in addition to the four key DORA metrics.
- “The four key metrics DORA used to correlate behaviors of high-performing organizations are a small subset of the metrics recommended in the book Accelerate. They also represent only one aspect of the health of a system…”
[January 25, 2023 -- Update:
In his LinkedIn article, Abi Noda summarizes
Common pitfalls of the DORA metrics, according to Nathen Harvey who helps lead DORA at Google:
Common pitfalls of the DORA metrics, according to Nathen Harvey who helps lead DORA at Google:
1. Comparing teams to each other based on the four key metrics. Different projects have different needs, so we can think more critically about whether a team's metrics should fall in the low, medium, or high performance category given that context.
2. Setting goals for improving the DORA metrics, and in turn creating the wrong incentives. Instead set goals to improve the capabilities or factors that drive the DORA metrics.
3. Spending more effort on pulling data into dashboards than on actually improving.
4. Not using the metrics to guide improvement at the team level. When the teams doing the work aren’t using the metrics to improve, this defeats the purpose of the metrics.
5. Using "industry" as an excuse for not improving. Even companies in well-regulated industries can focus on improvement.
6. Assuming you’re already world-class, so your organization doesn’t need to focus on improving. If software delivery is no longer the constraint, then what is? Identify what is preventing teams from making progress and focus on that.
7. Fixating on the four DORA metrics (which are outcomes) and forgetting about the capabilities. “We don’t get better at those outcomes by focusing on the outcomes. We have to focus on the capabilities that drive those outcomes.”
The big takeaways:
- the DORA metrics are outcomes not goals,
- context matters, and
- a team must look to understand and improve the factors that drive the DORA outcomes.
]
Tuesday, June 29, 2021
Software Productivity Metrics
"When a measure becomes a target,
it ceases to be a good measure."
― Goodhart's Law
"When a measure becomes a target,
it ceases to be a good measure."
― Goodhart's Law
Traditional research presentations such as Software Productivity Decoded by Thomas Zimmermann (co-editor of the book Rethinking Productivity in Software Engineering discussed in the previous blog entry) have focused on productivity measures for the development of software delivered on premises, e.g.
- Modification requests and added lines of code per year
- Tasks per month
- Function points per month
- Source lines of code per hour
- Lines of code per person month of coding effort
- Amount of work completed per reported hour of effort for each technology
- Ratio of produced logical code lines and spent effort
- Average number of logical source statements output per month over the product development cycle
- Total equivalent lines of code per person-month
- Resolution time defined as the time, in days, it took to resolve a particular modification request
- Number of editing events to number of selection and navigation events needed to find where to edit code
The Accelerate: State of DevOps Report 2019 has identified four metrics - commonly referred to as DevOps Research and Assessment (DORA) Metrics - that capture the effectiveness of the development and delivery process summarized in terms of throughput and stability. Their research has consistently shown that speed and stability are outcomes that enable each other.

They measure the throughput of the software delivery process using lead time of code changes from check-in to release along with deployment frequency. Stability is measured using time to restore— the time it takes from detecting a user-impacting incident to having it remediated— and change fail rate, a measure of the quality of the release process.
In addition to speed and stability, availability is important for operational performance. Availability is about ensuring a product or service is available to and can be accessed by your end users.
- Deployment Frequency—
How often an organization successfully releases to production. - Lead Time for Changes—
The amount of time it takes a code commit to get into production. - Change Failure Rate—
The percentage of deployments causing a failure in production. - Time to Restore Service—
How long it takes an organization to recover from a failure in production.
I found the webinar by Jez Humble, CTO of DORA / Google Cloud Develeoper Advocate, to provide a great overview of the content of the DevOps Report 2019:
Performance metrics
Improving performance Improving productivity Culture
[Update 06/23/2022: See my new blog entry How to Misuse and Abuse DORA DevOps Metrics to avoid common pitfalls when applying DORA metrics in practice.]
Julian Colina endorses these process metrics and warns against flawed output metrics in his summary of the Top 5 Commonly Misused Metrics:
- Lines of Code
- Commit Frequency
- Pull Request Count
- Velocity or Story Points
- "Impact“
Dan Lines even makes the point that Velocity is the Most Dangerous Metric for Dev Teams.
Velocity is a measure of predictability, not productivity. Never use velocity to measure performance and never share velocity outside of individual teams.
He proposes the following alternative measures:
- If speed to value is your main goal, consider Cycle Time.
- If predictability is your main goal, look at Iteration Churn.
- If quality is your priority, Change Failure Rate and Mean Time to Restore are good.
Be aware of the kind of culture you want to create by applying these measures as measuring the wrong things for the wrong reasons can backfire.
Patrick Anderson acknowledges that DORA Metrics help to deliver more quickly but notes their limited focus on product development & delivery leaving out the product discovery phase. He advocates end-to-end Flow Metrics as part of Value Stream Management to deliver the right things more quickly at the right quality and cost and with the necessary team engagement.
- Flow Time measures the whole system from ideation to production—starting from when work is accepted by the value stream and ending when the value is delivered to the customer.
- Flow Velocity—How much customer value is delivered over time.
- Flow Efficiency—What are the delays and wait times slowing you down?
- Flow Load—Are demand vs. capacity balanced to ensure future productivity?
- Flow Distribution—What are the trade-offs between value creation and protection work?
Check out the Linearb.io White Paper 17 Metrics for Modern Dev Leaders if you are looking for even more metrics clustered into three categories of KPIs (work quality, delivery pipeline, investment profile) across two dimensions (iterations, teams).
Somewhat similar Gitential has broken up its Value Drivers & Objective Metrics to Improve Your Software Development into four buckets (speed, quality, efficiency, collaboration):

The SPACE Framework (The SPACE of Developer Productivity) features five different dimensions of looking at productivity; hence the acronym SPACE:
- Satisfaction is how fulfilled developers feel with their work, team, tools, or culture; Well-being is how healthy and happy they are, and how their work impacts it.
- Performance is the outcome of a system or process.
- Activity is a count of actions or outputs completed in the course of performing work.
- Communication and collaboration capture how people and teams communicate and work together.
- Efficiency and flow capture the ability to complete work or make progress on it with minimal interruptions or delays, whether individually or through a system.
To measure developer productivity, teams and leaders (and even individuals) should capture several metrics across multiple dimensions of the framework—at least three are recommended.

Another recommendation is that at least one of the metrics include perceptual measures such as survey data. […]. Many times, perceptual data may provide more accurate and complete information than what can be observed from instrumenting system behavior alone.
Including metrics from multiple dimensions and types of measurements often creates metrics in tension; this is by design, because a balanced view provides a truer picture of what is happening in your work and systems.
This leads to an important point about metrics and their effect on teams and organizations:
They signal what is important.
One way to see indirectly what is important in an organization is to see what is measured, because that often communicates what is valued and influences the way people behave and react. […]. As a corollary, adding to or removing metrics can nudge behavior, because that also communicates what is important.
Listen to the Tech Lead Journal podcast #43 - The SPACE of Developer Productivity and New Future of Work - Dr. Jenna Butler (Microsoft) for an overview of the framework and other research initiatives related to the "New Future of Work". See link above for transcript, mentions and noteworthy links to related research articles.
In this context you may want to take note of Steven A. Lowe's six heuristics for effective use of metrics:
- Metrics cannot tell you the story; only the team can do that.
- Comparing snowflakes is waste.
- You can measure almost anything, but you can't pay attention to everything.
- Business success metrics drive software improvements, not the other way round.
- Every feature adds value; either measure it or don't do it.
- Measure only what matters now.
And if you want to read more about the topic then this blog provides further references.
Subscribe to:
Posts (Atom)